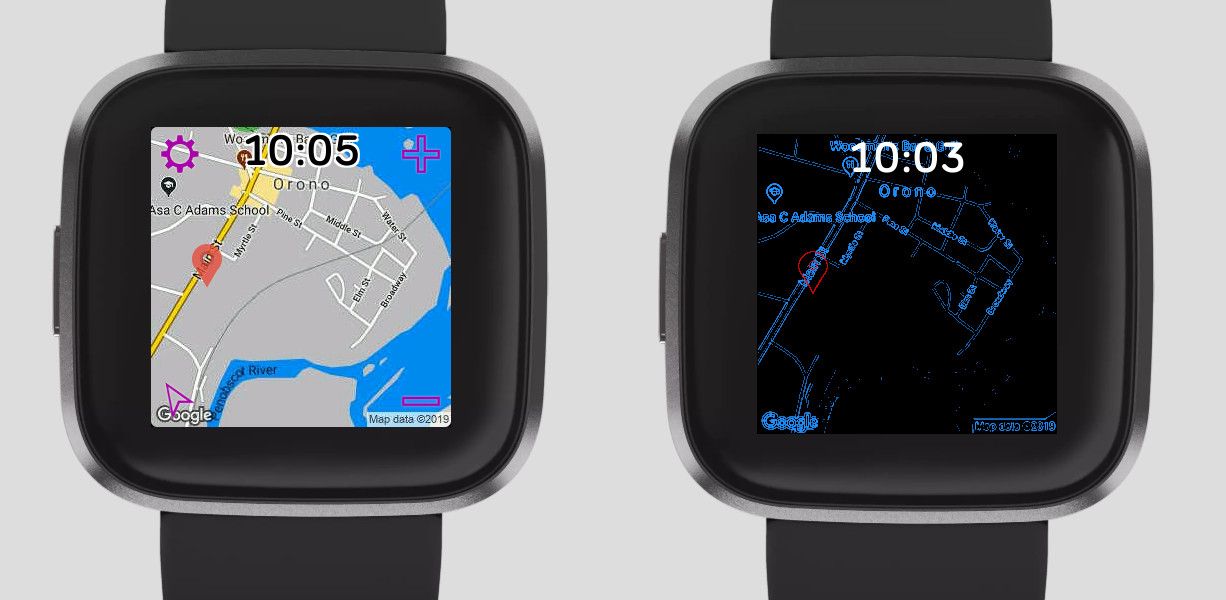
This article was the first guest blog post on the Fitbit Developer Blog.
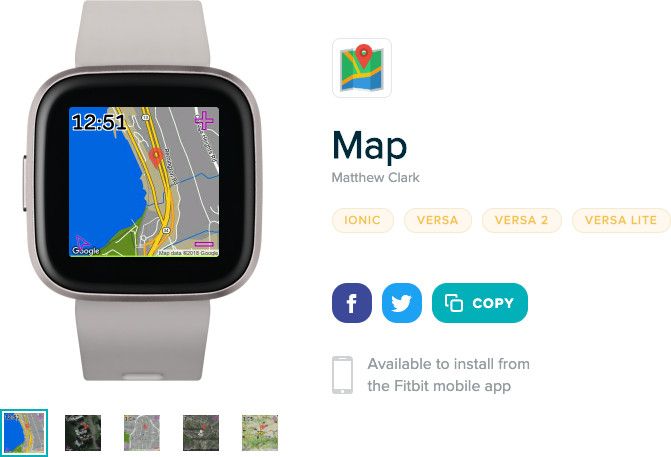
For years I have enjoyed programming smart watch apps, starting with the Pebble Watch and then eventually developing for the Samsung Galaxy Gear, Tic Watch, Android Wear, Apple Watch, and Fitbit. One of my more popular apps is the Map application for Fitbit. It supports several mapping services (Google Maps, HERE Technologies, Microsoft Bing, MapQuest) and users can track their current location on their wrist.
The Fitbit Versa 2 has a feature called Always-On Display (AOD), which allows clockfaces and apps to activate up to 20% of the pixels when the Fitbit device is not in an active display state. It is terrific – we can now easily see the time and other information without quick wrist flicks or pressing a button. Fitbit has generously allowed a few developers to program for this feature, and some of the solutions are quite clever.
My first attempt to extend the Map app just had the time displayed when AOD was active. I submitted the app for approval by Fitbit, but it was rejected because just displaying the time wasn’t unique. Clockfaces would have been approved with just the time displayed when in AOD mode, but for apps the bar is higher.
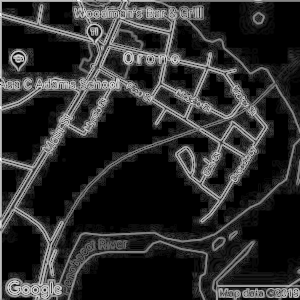
I thought that if I could create an image that was map-like for the AOD feature then it would be approved. I tried taking a map image and applying a Sobel Filter to highlight the edges of an image. Not bad, but some map images have many, many edges so the image did not necessarily have fewer pixels to display.
I needed to limit the activated pixels to just a fraction of those available on the display. My solution was to create a histogram to measure the range of the pixel edge intensity values, use this histogram to calculate a threshold value. I set the target to be 7.5% of the available pixels, which would leave some extra pixels that would be reserved for displaying the time and a location marker. All pixel values lower than the threshold value are zeroed out. In the example image shown, the threshold was computed to be 223 out of 255 (the maximum pixel value).
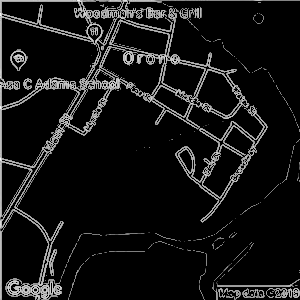
This processed image had to be sent to the Fitbit watch. The simplest solution was to create a JPEG image and send it. Sounds simple, but with one major flaw: JPEG is a lossy image compression scheme, so when the image is decompressed then many pixel values have very low intensity values. Therefore this solution will not work for Fitbit’s AOD feature, since at least 80% of the pixels must have a zero intensity value.
Perhaps I just send the image without compression. This is not complicated, but sending large images using Bluetooth takes too long and uses too much battery power. A Fitbit Versa 2 watch has 300×300 pixels, so sending red-green-blue (RGB) pxiel data in raw format would require 270 KBytes. Ouch. I needed to find a smart image format with lossless compression.
I recalled learning about an image format called TXI that Fitbit uses internally for images within its smart watch platform. However the TXI format is not publicly available (or so I thought). Thanks to some sleuthing, I found some relevant code used by Fitbit when their apps are compiled. A key file was within the folder node_modules/@fitbit/image-codec-txi/mod/encoder.js, and later learned that the source code was indeed available. This file had important constants, methods, and referenced other libraries with relevant functions.
While exploring the TXI libraries I learned that I could do a few things to reduce the image size. TXI supports grayscale images, so I could switch from RGB to monochrome, reducing the data requirements by about 2/3rds. TXI supports a lossless compression technique called run-length encoding or RLE. To increase the likelihood of having repeated pixel values for higher compression, I quantized the remaining pixel limiting the intensities to just eight values.
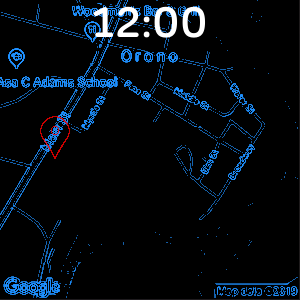
This solution worked! I could now process a map image and turn it into a crude representation of a map that uses just 10% of the pixels. A raw image may be 270 KBytes in size, but my reduced edge map was only about 15 KBytes. For a final touch I decided to color the grayscale edges blue, and overlay a red location marker. When AOD is activated, the map displays a screen like the one at the right. The street names and labels are not that readable, but a clear map image is just a flick or button-press away.
Here is a summary of the steps implemented for this solution:
- retrieve 300×300 map image from mapping service
- render image into two-dimensional array of pixels
- convert from RGB to grayscale
- calculate histogram of grayscale pixels
- compute 92.5% intensity value based on histogram
- set pixel values to zero if they are below the threshold value
- quantize remaining pixel values to a limited set
- create TXI-format file from pixels using RLE compression
- transmit TXI file to Fitbit smart watch
- display this new image when always-on display is enabled
Fitbit has approved the updated Map app, and it is available for free in the Fitbit app gallery.
Need help building a wearable app?
Read more about our Wearable App Development services
